Debugging
Writing scripts can be difficult. Sooner or later an error will sneak into your code. This error will cause defects and problems when executed. Debugging is the art of finding and correcting errors in code.
You have two tools are your disposal: print() and the debugger. While print() can be very useful, it is not very powerful. The debugger however, is very powerful. It can pause the program and step through the code; line by line. The debugger can also inspect variables and values. It is designed specifically to correct errors and squash bugs.
Requirements
These requirements must be met in order to use the debugger:
The debugger must be enabled in-game,
you must install a VSCode extensions,
and correctly configure VSCode.
Installation
Open Ravenfield Tools Pack in VSCode
Install the
xanathar.moonsharp-debugextension (how-to install extensions)Open the Debug Configurations in VSCode (Debug > Open Configurations)
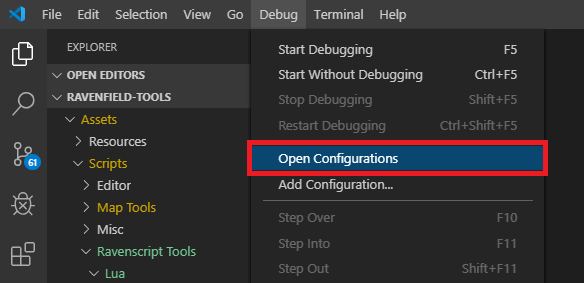
A new tab with
.vscode/launch.jsonwill openModify it to contain:
{
    "version": "0.2.0",
    "configurations": [
        {
            "name": "MoonSharp Attach",
            "type": "moonsharp-debug",
            "debugServer" : 41912,
            "request": "attach"
        }
    ]
}
Save and close the file
Press F5 to bring up the Debugger
Usage
Limitations
Warning
Script reloads break the debugger?